Has The FALCON Method by David Solyomi been sitting on your reading list? Pick up the key ideas in the book with this quick summary.
An investment isn’t just a handful of digits on a screen – your hard-earned cash is on the line. Managed well, your portfolio is a ticket to financial independence and even early retirement; managed poorly, it’s a black hole which swallows up your livelihood. In short, the stakes are high.
You don’t need to be a financial whiz to know that the most important decision is what to buy – but it’s not as simple as just identifying lucrative openings. This where the FALCON Method comes in.
Named after the author’s surname, which means “falcon” in Hungarian, the FALCON Method directs your attention to a single, fruitful asset class: company shares. This method helps unravel the tangled financial landscape by providing you with an objective set of measurements to evaluate different businesses. By ranking the best of these on a set of equations, we reveal which are ripe for investment.
In this summary of The FALCON Method by David Solyomi, you’ll learn
- why stocks reign supreme;
- why a company is like a black box; and
- how you should handle your portfolio once you’ve taken the plunge.
The FALCON Method Key Idea #1: When it comes to different types of investments, stocks are superior.
Stocks, options, bonds, mutual funds and commodities: The variety of asset types available in the financial world can make anybody's head spin. Professionals devote their lives to studying the investment landscape, so how can the rest of us hope to discern which assets are best? Thankfully, some of these professionals have given us a helping hand.
One of these is Warren Buffett, one of the most successful investors of all time and a constant source of financial wisdom. In a 2011 letter to his shareholders, he outlined three main investment classes and revealed his stand-out favorite.
The first is currency-based investments. These investments are tied to a national currency, and bonds are the most common example. Basically, bonds are a type of loan. The bond issuer – usually a corporation or government – sells a bond to an investor. The bond issuer also agrees to buy the bond back in the future for the same amount, plus interest.
Bonds are a currency-based investment because they’re issued and repaid in a certain currency – whatever happens, they’re tied to this medium. But currency-based investments contain a fatal flaw: You’re trusting that the national currency won’t rise due to inflation! If you have a currency-based investment worth $10 and inflation increases by 10 percent, $1 of your invested cash has vanished.
Buffett's second class is unproductive assets, investments which won’t generate extra income once you own them. Commodities such as wheat, oil and gold are the main types of unproductive assets. They’re unattractive too, because investors don’t earn a secondary income from owning them; they’re simply hoping to eventually sell them for more than they paid for them.
Buffett’s third category, productive assets, are the best type for building wealth and generating a reliable long-term income.
Productive assets, like a company or buy-to-rent real estate, aren’t tied to a national currency – it’s always possible to value them against gold or another currency. They also generate a secondary income, perhaps by earning the owner rent.
The best productive assets are company shares. Each share represents partial ownership of a company. For example, buying shares in Coca-Cola means that you’re part owner of the business – a shareholder – and are entitled to a share of its profits. These are paid out in the form of dividends, usually on an annual basis. What’s more, an investor still has the underlying value of her shares, which she can sell on the market at any time.
The FALCON Method Key Idea #2: Effective investment in shares requires an understanding of how companies generate and use cash.
So, we’ve explored a few asset types and seen how stocks reign supreme. But picking a great asset type doesn’t guarantee an early retirement! To invest prudently, we should understand how companies operate and learn how to evaluate them.
A great metaphor for thinking about companies is that of the black box, something put forward by author David van Knapp in his book Sensible Stock Investing.
In van Knapp’s view, a firm is like a black box with input and output pipes attached to it. As an outsider, you’re unaware of what happens inside the box, but firms exist to generate money, so more cash must go out through the output pipes than goes into the input pipes. Thinking of companies this way focuses our attention on analyzing these pipes.
Examples of input pipes include revenue – which is the money a company generates from selling its goods or services – and equity sales. The most common equity sale happens when a company issues and sells new shares. It’s important to pay attention to this pipe, because it means the value of already-existing shares will be diluted.
Examining output pipes is important too. These are things like ongoing expenses, such as staff salaries and advertising fees, and payments on debts. There are also things like acquisitions – when one company buys another – along with taxes on profits to consider.
When scrutinizing a company, the most important output pipe to examine is its profits. That’s because the way a firm uses them is a telltale sign of a great investment opportunity. Be on the lookout for companies doing these three things with profits:
First, take note of payments to shareholders in the form of dividends. A company obviously needs to generate a return for shareholders in order for it to be a sound investment!
Second, be aware of share buybacks. This is a common business practice which involves a company purchasing their own shares on the open market. They do this to reduce the overall number of shares in circulation, which increases the value of each remaining share and increases the amount of dividend per share.
Third, look out for retained earnings. This is cash recycled back into the company for growth and expansion.
The best thing about the black box metaphor is its pragmatism – it makes sure you don’t harbor illusions about what you simply can’t see. Instead, it directs your attention toward the crucial areas of what you can see.
Check it out here!
The FALCON Method Key Idea #3: The FALCON Method recommends a “buy and hold” portfolio for the best chances of success.
Ever pictured yourself as a professional stock trader? Perhaps perched behind your laptop on a tropical beach, clocking up wins? Well, for the sake of your portfolio, keep these as pipe dreams: A lavish trading lifestyle is only profitable for a tiny minority. Instead, most investors stick to the classic quantum investing model.
Quantum investing works by ranking a set of stocks according to a set of quantitative criteria, such as the amount of dividends paid per share. This is commonly known as the dividend per share figure. Once ranked, an investor buys the best of the bunch. These are held for a period of time, usually 12 months, before being sold. The process is then repeated.
The quant method, as it’s known, can be useful: By relying on quantitative criteria and a defined time frame, it removes psychological bias from trading, which is the most common way to lose money. But it also has several disadvantages.
First, many quantitative criteria will generate a list of companies completely unknown to you. It’s hard – and also unwise – to commit your capital to a firm you don’t know well.
Second, the classic quant method is inconsistent. Because no investment method is faultless and you are picking a bunch of new companies annually, sometimes there are one-, two- or three-year periods where you’ll have to deal with losses. Most traders don’t have the patience to stick through these.
But there’s a different approach to classic quant investing: the FALCON Method.
Like the classic quant method, the FALCON Method is designed to limit psychological errors and emotional decision-making. But unlike the quant method, the FALCON Method advocates a buy and hold approach which prizes long-term investments. Here, the goal is to receive continuous dividend payouts and anticipate an increase in the stock’s underlying value, at which point investors will sell their asset for a profit.
Additionally, the FALCON Method suggests only purchasing stocks in reputable, well-known companies. Household names are much easier to have faith in than a bunch of unknown, constantly changing companies.
Because of a clear structure which only lets human subjectivity creep in at the final phase, the FALCON Method prevents our biases from causing costly mistakes. By this point, all stocks which survive the rigorous filtering process are above-average investment opportunities.
The FALCON Method Key Idea #4: With the FALCON Method, the first step is to select a group of top-quality companies.
So, we want a buy and hold portfolio consisting of shares in well-known companies. Now it’s time to drill down into the specifics of the FALCON Method and build a shortlist of potential purchases! But what household names are worth our time?
Well, the FALCON Method concentrates on a specific group of companies which have been paying dividends for at least 20 years, and haven’t reduced the amount paid during this time.
Why the focus on dividends? Because they represent the only truly reliable item in corporate reports.
Other items, like revenue and cash-flow figures, are able to be distorted by unethical activities and unscrupulous accountants. Just ask the former executives of Enron, an electricity and natural gas supplier. In 2000, Enron claimed revenues of nearly $101 billion. Then, in 2001, the company’s hugely fraudulent accounting practices, including falsifying revenue reports, were exposed. Enron filed for bankruptcy later that year.
Dividend payouts, unlike revenue, cannot be manipulated; they’re transparent payments made by the company to their shareholders.
Twenty years of dividend payments might seem like an excessive time frame to consider but it’s a sensible practice for two reasons.
First, it allows us to assess how the management of a company behaves in times of trouble, such as the financial crisis in 2008. Second, the ability to pay a consistent amount of dividends to shareholders is a sure sign of a company’s consistent earning power.
Companies with reliable, consistent earnings tend to overperform so it’s no wonder that companies paying dividends consistently are the sweethearts of investors. That’s why the S&P 500 index, which groups together publicly-traded companies for measurement purposes contains a group of companies called the Dividend Aristocrats. These companies stand out for having increased dividend payments for over 25 consecutive years.
However, there’s a weakness in focusing solely on the Dividend Aristocrats and increasing dividends. First, why limit ourselves to companies on the S&P index? There’s an ocean of opportunities lying outside these 500 firms. Second, if a company retains the same dividend payment for two consecutive years, it’s removed from the Dividend Aristocrats’ list. The FALCON Method takes a more flexible approach, understanding that sometimes it’s better to channel resources into securing a firm’s future. That’s why it concentrates on firms with a long dividend history and no reductions to that dividend.
Of course, a good dividend record doesn’t always make a great investment, but it is a positive sign.
The FALCON Method Key Idea #5: The FALCON Method’s second step is identifying stocks that can be bought cheaply.
Buying high-quality items at discount prices is a wonderful feeling. The trouble is that, thanks to the internet, sellers have never been better informed about what their goods are worth. If we do stumble across a discount, it can be gone in an instant – a true steal is usually snapped up in an instant.
But bargains still exist and brevity isn’t a bad thing, especially not in investment: If you’ve bought into a bargain, prices will rise after time to reflect the underlying value of your asset.
The key to getting a great deal is to understand that every company has a price assigned to it by the market, which fluctuates daily. This price is different from the underlying value of a company, which is comprised of the company’s assets, financial health and future potential. So, by evaluating a company’s underlying value and taking note of the historical price of its shares, investors can secure a discount by purchasing shares in valuable companies when prices are cheaper than the historically-accepted average.
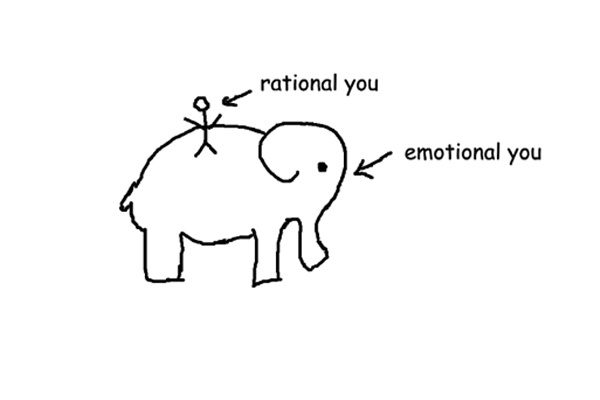
The reason this works is because businesses create value and humans set prices. Humans are fickle and intrinsically emotional creatures. We are subject to psychological biases and feelings of greed and fear. This innate nature of ours is what causes stock market prices to fluctuate so wildly. Just look at what happens in a stock market panic: Investors flock to sell their shares and are willing to sell them for low prices.
This is the very moment when smart investors strike.
When market sentiment is pessimistic – either in an individual company or the wider economy – stock prices will decrease relative to the asset's underlying value, something that generally stays the same. This makes buying top-quality companies during times of pessimism a sure-fire approach to earning a healthy profit.
But following this approach isn’t as easy as it sounds. It means disagreeing with the whims of the crowd and making decisions which run against the trend of the market. This technique requires a lot of knowledge, but also a little bravery.
Finally, it’s crucial to understand that this market trend works in reverse – just as prices fall during times of panic, prices rise during times of euphoria. Tempting as it may be to buy stocks in Amazon, Google or Walmart as they soar, a wise investor never buys into hype at over-inflated prices.
The FALCON Method Key Idea #6: The third step of the FALCON Method is creating reliable filters to refine your shortlisted stocks.
So, we now have our shortlist, but we also need to do some more filtering based on more advanced financial indicators.
There are three main indicators the FALCON Method uses: dividend yield, free cash flow yield and shareholder yield.
Dividend yield is the dividend a stock will produce compared to the price of that stock. It’s calculated by dividing the amount a stock is expected to pay in the next year by the current price of that stock. For example, if one share in Microsoft is expected to pay $1, and that share costs $10, then its dividend yield is 0.1, or 10 percent.
Free cash flow yield is one criterion that investors often overlook. Put simply, free cash is the money left over after a company pays for its essential operational costs. Free cash flow yield measures the relationship between this figure and the current market price of a share.
To calculate it, divide a company’s free cash flow yield by its total number of shares, producing a figure known as free cash flow per share. Then, divide free cash flow per share by the current market price of one share. For example, if Amazon has a free cash flow of $200 and 100 existing shares, its free cash flow per share is $2. If a share in Amazon costs $20, we know that their free cash flow yield is 0.1, or 10 percent.
Finally, a firm’s shareholder yield shows how much money a company sends back to its investors through a combination of dividends and share buybacks. Share repurchases occur when a company buys back its own shares on the open market, increasing its ownership stake in the company and increasing the value of all remaining shares and future dividend payments.
Calculating it takes a couple of steps. Let’s imagine that Google spent $100 on dividends and $150 on share repurchases in 2018. Our first step is to add these together, giving us $250. Then we’ll subtract the value of new shares issued from that; let’s say that amounts to $50. We’ll then divide the $200 that we’re left with by Google’s market capitalization, that is, the value of all existing shares combined. If market capitalization is $5000, dividing 5000 by 200 gives Google a shareholder yield of .04, or 4 percent.
When applying these filters to our companies, define minimum values for all three indicators. There is no magic number, but be sure not to set these too high: This method makes it difficult for companies to pass all three filters even if they have moderate values. If a company passes one, it still must get over the next two hurdles!
The FALCON Method Key Idea #7: Step four of the FALCON Method: Rank the survivors.
The FALCON Method doesn’t rank stocks based on simple, one-dimensional factors: In the Method’s fourth step, it identifies and ranks stocks that are the cream of the crop using something called weighted multifactor ranking. This uses multiple factors to rank our stocks and also decides how much weight to assign each factor.
Let’s look at an example. Say we are ranking two companies – Stock A and Stock B – on three factors: dividend yield, free cash flow yield and shareholder yield. We first need to choose how much weight to assign each factor. Here, we’ll opt for equal weighting – meaning that each factor will be worth 33.3 percent of our final score. You can choose any weights you like, though, as long as they total 100 percent.
Let’s look at this in practice: Stock A has a dividend yield, free cash flow yield, and shareholder yield of 5, 7 and 10 percent respectively. Stock B, on the other hand, clocks in at 10, 5 and 12 percent. We know that each stock’s factor is worth 33.3 percent, or 0.333. Thus we can calculate the stocks’ final scores by multiplying each of the three yield percentages with this number and add them all together. For Stock A, this would result in a final score of 10.6 and for B, 8.9.
Although the three factors we’ve used in this example to rank Stock A and Stock B would be fine, we’ve already used them as our filters in a previous step. So instead, we should use some new metrics we’ve not used before.
The FALCON Method suggests using a modified version of the Chowder Rule – a protocol comparing a stock’s current dividend to its potential for future growth.
This works by adding a stock’s dividend yield to the percentage a stock’s dividend has grown by in the last five years – if the stock’s dividend yield is more than 3 percent, this number must be greater than 12. If less than 3 percent, it must be greater than 15.
However, focusing only on a five-year timeframe can obscure important data: What if the company paid a high dividend for four years, but cut this in the last twelve months? Instead, the FALCON Method recommends constructing multiple Chowder Rules with varying timeframes (one, three or five years) and using each as a factor in the weighted ranking.
The FALCON Method Key Idea #8: In the fifth step of the FALCON Method, incorporate your own judgment.
So far, the FALCON Method has concentrated on using quantitative indicators because they are free from psychological bias. But subjective judgment is useful if used carefully – and by postponing this until our last round of selection, we can almost guarantee that all remaining stocks are first-rate investment opportunities. Let’s explore some things to look out for when making the final decision.
First, pay attention to the ROIC indicator. ROIC stands for return on invested capital. As a shareholder in a company, you have a stake in that enterprise which is equal to the amount of money you have invested into it. A good investor should always monitor how well a firm’s management uses the capital at its disposal, and that’s where the ROIC indicator comes in. This tool is found on most online trading platforms and assesses how efficient a company is at allocating its resources to profitable activities. The higher the ROIC, the better.
Also, pay attention to stocks which are cyclical and try to avoid them. A cyclical stock is one whose price fluctuates wildly, with large peaks and troughs.
Take the ten-year price history of the Chevron Corporation, a US oil and gas company. From a high of almost $100 per share in 2008, prices plummeted to $60 in 2009. The next year saw a steep rise, peaking at over $130 per share in 2013, before crashing yet again to $75 one year later. These cyclical trends are often found in volatile industries, such as the oil and cryptocurrency markets.
You’d be forgiven for thinking that investing in cyclical stocks is a savvy move, but placing your capital here is often counterintuitive because of the extra risk it poses. After all, no-one can tell when a cyclical stock has hit its bottom; volatile markets can make you rich in no time, but they can also make you poor just as quickly. What’s more, this approach butts heads with the FALCON Method’s buy and hold philosophy; steady, consistent growth over the long term wins the day.
Using qualitative judgment to assess the ROIC and overall trading pattern can be useful, but only as a final pointer toward your chosen stocks. The FALCON Method’s first four steps have done the heavy lifting for us by using structured rules and leveraging powerful financial indicators to reveal the best investment opportunities. No investment method is flawless, but this method, just like its bird of prey namesake, is precise when it hunts.
Final summary
The key message in this book summary:
The FALCON Method advocates a precise and unemotional investment strategy which focuses on rigorous company evaluation and a buy and hold philosophy. Its well-structured process focuses on long-term dividend payers and applies a strict set of filters to weed out dodgy deals and subpar investments. By following the FALCON Method’s steps and using its recommended financial indicators, average traders can give themselves the best possible chance for growing their wealth and building a passive income.
Actionable advice:
Go out and do some analysis.
Now that you’re up to speed with the FALCON Method, test these techniques by building your own list of companies. You could start by referencing a well-known index of companies, such as the Dow Jones Industrial Average or the S&P 500. Draw up a list of the long-term dividend payers and away you go!