Has The Signal and the Noise by Nate Silver been sitting on your reading list? Pick up the key ideas in the book with this quick summary.
“Prediction is very difficult, especially about the future”: so goes a quote often attributed to Danish physicist Niels Bohr.
Indeed, predictions are very difficult, as can be seen by looking at the dismal track records of experts’ predictions in diverse fields, such as meteorology, sports betting and politics. Even worse, experts tend to be fairly confident about the quality of their predictions despite historical data showing the opposite.
This book summary will outline the difficulties in predicting economic development and in locating the few pieces of key information – i.e., the signal – in the vast mass of data available – i.e., the noise.
In this summary of The Signal and the Noise by Nate Silver, you’ll find out
- why you could’ve made some outstanding profits based on who won the Super Bowl each year for three decades,
- why a positive mammogram result can still only mean a 10 percent chance of having breast cancer and
- why it’s natural that stock traders don’t care if a bubble forms in the market.
The Signal and the Noise Key Idea #1: Economists are bad at both forecasting the economy and estimating the certainty of their forecasts.
Will you walk to work today or take the bus? Will you take an umbrella or not?
In our everyday lives, we make decisions based on predictions of what will happen in the future, like whether it will rain or shine.
But predictions are also common in the public realm: stock market analysts, meteorologists and sports commentators all make a living out of them.
One area where one might expect particularly good predictions is the economy. After all, it’s of crucial importance for individuals, companies and even nations, and there’s a wealth of data available: some companies track as many as four million economic indicators.
But despite these factors, economists have an atrocious track record in forecasting.
Consider the commonly predicted economic indicator, the gross domestic product (GDP).
The first problem with GDP predictions is that economists often make predictions like “Next year, GDP will increase by 2.7 percent.” In fact, they’ve derived this figure from a broad prediction interval that says something like “It is 90 percent likely that GDP growth will fall somewhere between 1.3 and 4.2 percent.” So an exact number as a prediction is misleading, as it gives a false sense of precision and security.
What’s worse, economists aren’t actually very good at coming up with prediction intervals either. If their 90 percent prediction intervals were roughly accurate, one would expect the actual GDP to only fall outside the prediction interval one out of ten times. However, a poll of professional forecasters shows that, since 1968, they’ve been wrong roughly half the time. Therefore, it seems that economists’ are not only poor predictors but also gravely overestimate their predictions’ certainty.
Besides GDP predictions, economists are also spectacularly bad at forecasting depressions. Consider that, in the 1990s, economists were only able to predict two out of the sixty depressions that had occurred worldwide one year ahead of time.
To put it kindly, economic predictions should be taken with at least a grain of salt.
The Signal and the Noise Key Idea #2: Forecasting the economy is so difficult because it’s a complicated and dynamic system.
Why is predicting the economy so hard?
Quite simply, because a staggering amount of interwoven factors can influence it: a tsunami striking Taiwan can affect whether someone gets a job in Oklahoma.
What’s more, figuring out the causal relationship between different economic factors can be a headache. For example, unemployment rates are generally considered to be affected by the underlying health of the economy because businesses tend to hire more in healthy economic climates. But unemployment rates also influence how much money consumers have to spend, which impacts consumer demand and thus the overall health of the economy.
The above example illustrates another complicating factor: feedback loops. When businesses have increased sales, it spurs them to hire more workers. This then gives those workers more disposable income, which increases consumption and further boosts sales.
There are also external factors that can distort the meaning of many economic indicators. For example, rising house prices are normally a positive indicator, but not if they’re being artificially inflated by government policies.
Ironically, even economic predictions themselves can also affect the economy as people and businesses adjust their behavior depending on them.
And not only the state of the economy is affected by a myriad of factors: the very basics of forecasting are also constantly in flux.
First of all, the global economy is constantly evolving, so even tried-and-true theories go rapidly obsolete. But since it’s impossible to predict when, exactly, this will happen, existing rules of thumb are relied upon until found to be broken.
Second, the data sources that economists work with to understand the past and present are very unreliable, and subject to constant revision. For example, US government data on the last quarter of 2008 indicated a mere 3.8 percent decline in GDP, but the data was later revised and indicated a near 9 percent decline.
No wonder accurate predictions are hard to come by.
The Signal and the Noise Key Idea #3: Statistics-based forecasting alone is not enough – human analysis is still needed.
As stated in the previous book summary, the economy is such a complex web of interrelated factors that causality is hard to define. This has lead many economists to try a purely statistical approach: instead of trying to understand what causes have which effects, they just look at huge swathes of data hoping to spot patterns.
Unfortunately, this approach is fraught with potential for errors because it is inevitable that some patterns will emerge due to coincidence alone.
For example, consider that from 1967 to 1997, the winner of the Super Bowl seemed strongly correlated to economic development: in twenty-eight of those thirty years, a winner from the National Football League meant stock market gains for the rest of the year, whereas a winner originally from the American Football League predicted stock market losses. Statistics indicate that the likelihood of this relationship being a coincidence is one in 4,700,000. Clearly, economists should start watching more football, right?
Wrong. In fact this correlation is due to chance alone, and since 1998, the trend has actually been reversed.
With over four million economic indicators being tracked, it is clear that some coincidental correlations like this one will arise. And relying on them to make predictions will eventually backfire, for the coincidence will come to an end some day.
It is therefore crucial that, even if we use technology to wade through huge masses of data, there is still a human there to do the analysis and consider whether there is plausible causality.
But many people don’t realize this. Instead, they try to get more and more information and economic variables to draw predictions from, believing that it will make predictions more accurate when, in fact, all it does is increase the amount of useless information – or noise – which in turn makes it harder to spot useful information – or the signal – hidden within.
The Signal and the Noise Key Idea #4: Many experts failed to predict the 2008 collapse of the US housing bubble.
Let’s turn our gaze now to four forecasting failures in the run-up to the financial crisis of 2008, starting with those related to the housing bubble.
The first was the overly optimistic belief of homeowners, lenders, brokers and rating agencies that the meteoric rise of US house prices would continue indefinitely. They held this belief despite the fact that, historically, a meteoric rise in housing prices combined with record-low savings had always led to a crash.
So how could everyone have missed that?
One contributing factor was probably that everybody was making too much money in the booming market to begin questioning whether a recession might be around the corner.
The second failure was committed by rating agencies regarding the riskiness of financial instruments called collateralized debt obligations (CDOs), which consisted of a bundle of mortgage debts. The idea was that, as homeowners made payments on their mortgages, investors who held CDOs would earn profits.
Since CDOs were a completely new kind of financial instrument, agencies had to rely solely on statistical models based on the risk of individual mortgages defaulting. Unfortunately, this neglected the possibility of a large-scale housing crash which could bring down prices across the board.
The result was, of course, disastrous. The rating agency Standard & Poor’s had claimed, for example, that the CDOs it gave an AAA-rating only had a 0.12 percent chance of defaulting but, in fact, some 28 percent of them wound up defaulting.
The Signal and the Noise Key Idea #5: Over-optimism in the US government and banks also spurred the financial crisis.
Continuing from the previous book summary, let’s examine the two other forecasting failures that contributed to the financial crisis that started in 2008.
The third predictive failure happened at American financial institutions, which were so eager to chase after profits in the booming market that they leveraged themselves excessively with debt to make more investments.
Take the investment bank Lehman Brothers, which had leveraged itself so that it only had $1 of its own capital for every $33 worth of financial positions it held. In other words, if the value of its portfolio had declined by even 4 percent, it would have faced bankruptcy. Other major US banks also had similarly high levels of leverage. It was as if the industry collectively believed that a recession was impossible.
Of course, this leverage was helping them make huge profits at the time, so no one was too interested in seriously considering the likelihood of a recession.
The fourth failure in prediction was committed by the US government after the recession had struck. As the government’s economic team was crafting the stimulus package in 2009, they thought they were dealing with a regular recession where employment figures would bounce back in one to two years. But history shows that recessions caused by a financial crash usually make unemployment rates stay high for four to six years – and since this recession was caused by such a crash, they should have known better. This made their stimulus package woefully inadequate.
In the next book summarys, we’ll discover some key ways to overcome these difficulties.
The Signal and the Noise Key Idea #6: Bayes’ theorem can help you update your beliefs rationally as new information arises.
As we’ve seen, forecasting is fraught with difficulties.
One key way of overcoming them when estimating probabilities is to adopt the so-called Bayesian approach, a theorem based on work by eighteenth century English minister Thomas Bayes. This approach provides a mathematical framework for updating one’s beliefs in a rational way as new information comes in.
As an example of how beliefs should be updated, let’s consider this scenario: you’re a woman in your forties worried about breast cancer, so you want to predict how likely you are to have it.
To start with, you see that studies indicate that around 1.4 percent of women develop breast cancer in their forties. This is known as the prior probability: the probability you assume before you get any new information.
Then you decide to get a mammogram, as that procedure can detect breast cancer. To your horror, the result is positive.
What does that mean?
Probably less than you think.
Mammograms are by no means foolproof. On the one hand, if a woman does have breast cancer, a mammogram will only discover it about 75 percent of the time. On the other, even if a woman doesn’t have breast cancer, a mammogram will still indicate that she does about 10 percent of the time.
So knowing this and Bayes’ theorem, how likely is it that you have breast cancer after the positive mammogram?
You may be astonished to hear the likelihood is only 10 percent. What’s more, clinical data confirms this.
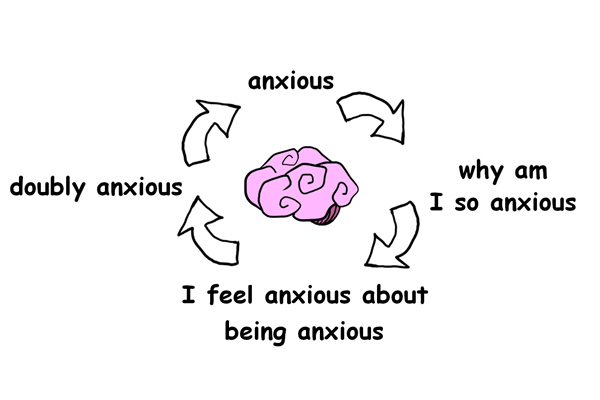
This surprise highlights that we don’t have a very good intuitive understanding of how new information, like the mammogram’s result, interacts with old information.
Specifically, we tend to focus too much on what’s new, overemphasizing the mammogram’s result and forgetting that, in fact, the incidence of breast cancer is so low that the false positives far outweigh the correct positives.
Using Bayes’ theorem helps us avoid our inherent biases, like our preference for recent information.
The Signal and the Noise Key Idea #7: Cautious, meticulous and diverse predictions tend to be better than brash ones.
To understand another key to making better forecasts, let’s take a look at what kind of people make the best predictions.
Beginning in 1987, a psychologist and political scientist by the name of Philip Tetlock began recording predictions on topics like politics and the economy made by a wide variety of experts.
After analyzing the accuracy of these predictions as well as the personalities and thinking styles of the experts that made them, Tetlock began to see a clear pattern.
It turned out that the more successful predictors were likely to use strategies where they tried to integrate many little pieces of knowledge, whereas the less successful ones tended to just hang on to one big idea or fact.
He named these two types of people the hedgehogs and the foxes.
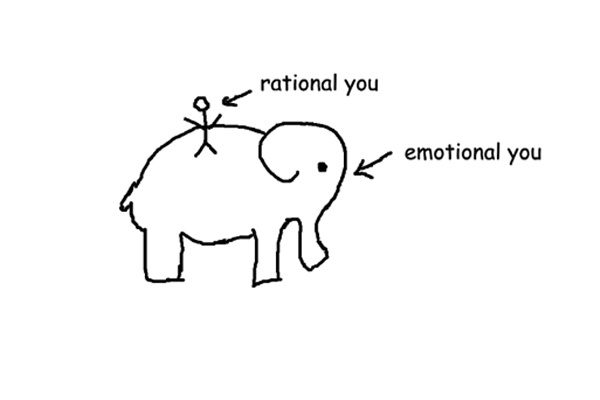
Hedgehogs are typically brash and confident, claiming that they have discovered big, governing principles that the world adheres to: think Sigmund Freud and the unconscious.
Foxes, however, tend to be more cautious and meticulous, contemplating matters from various perspectives and carefully weighing the pros and cons. They are also more likely than hedgehogs to rely on empirical evidence and data, willingly discarding their own ideologies and preconceptions and letting the data speak for itself.
Of course, hedgehogs’ confidence has much more media appeal, hence their predictions tend to garner far more attention than the foxes’. But, at the end of the day, it was the foxes who had better predictions. In fact, the hedgehogs’ predictions were overall only little better than ones made at random.
So it seems that good predictors are made good by taking into account many different factors and weighing them from as many perspectives, not by relying on simple, big truths.
In the following book summarys, you’ll discover how to use some of what you’ve learned to make better predictions in notoriously hard-to-predict areas.
The Signal and the Noise Key Idea #8: Stock markets are hard to beat because they tend to be efficient.
One notoriously difficult phenomenon to predict is the short-term behavior of the stock market. Sure, in the long run, the average value of stocks tends to increase, but this information is of little use to most traders because they want to “beat the market.”
A desire that has proven to be spectacularly difficult to fulfill.
For one, it’s hard for one person to predict the behavior of the market well. In fact, one study showed that when seventy economists made stock market forecasts over a multi-year period, their aggregate prediction was always better than any individual’s.
This difficulty was also seen in a study of mutual and hedge funds: it found that, just because one fund did well in a particular year, it was no more likely than the others to beat its competition in the following year. Clearly, the success was just a fluke, and no fund was really better at predicting the market than the others.
Why is beating the market so difficult?
Because the stock market is usually very efficient, i.e., there are no easy, sure-fire wins to be had. Most trades are made by very smart, capable people on behalf of large financial institutions which have huge amounts of data and expertise at their disposal. This means that if a stock is over- or underpriced, the market will correct that very quickly.
The only surefire way to beat the market is to know something no-one else does. And the only source for such an advantage tends to be illegal insider information. Interestingly, one group of investors which seem particularly adept at beating the market are members of Congress, whose investments tend to exceed the returns of the overall market by 5 to 10 percent annually. This is especially noteworthy given that they are privy to insider information through lobbyists, and can also impact the business prospects of companies by means of legislation.
In the next book summary, you’ll see one area where the market is decidedly not efficient.
The Signal and the Noise Key Idea #9: Stock market bubbles can be predicted by looking at stock prices and the P/E ratio.
Though the stock market usually tends to be efficient, this is not true when bubbles form, meaning situations where stocks are overvalued.
Though there is no foolproof way to predict a bubble, there are some telltale signs.
First, there’s the obvious clue: a sharp increase in stock prices in general. In fact, looking at historical cases when the S&P 500 stock market index increased at double its long-term average over five years, in five out of the eight cases it ended in a severe crash.
Second, you can keep your eye on the price/earnings, or P/E ratio, of stocks: the market price per share divided by the total annual earnings of the company per share.
In the long run, the P/E ratio of the entire market tends to be around 15. This means that if the average P/E ratio in the market is much over that, say 30 – as it had been at the height of the dot-com bubble in 2000 – you have a pretty good indication that a bubble is forming.
But why do such bubbles form? Shouldn’t investors spot them and sell, thus bringing the prices back down?
Well, actually, if you think about it, they shouldn’t.
You see, most institutional investors invest on behalf of their firm and their clients. When they perform well, they get huge bonuses, and when they perform badly, they might be fired.
Thus, even when they see a bubble is forming, they keep buying and reaping bonuses as the market soars. When the crash does eventually happen, they’ll only have lost their company’s and their clients money, not their own.
What’s more, all their colleagues do the same, so it’s unlikely they’ll be singled out and fired. In fact, after the last three big crashes on Wall Street, only about 20 percent of staff lost their jobs, so there’s an 80 percent chance traders will keep their jobs even if they ignore the bubble.
The Signal and the Noise Key Idea #10: Simple climate models tend to work better than complicated ones.
Like the economy, the climate comprises a very complicated, interrelated system which is very difficult to model and make predictions about.
Even very sophisticated models that take into account countless factors, like El Nino cycles and sunspots, have failed spectacularly. For example, the International Panel on Climate Change (IPCC) based its 1990 prediction on such a complicated model, stating that, over the next hundred years, global temperatures would increase by between two and five degrees, with three degrees being the most likely result. But observations made over the next eleven years indicated this was completely wrong: the pace was only 1.5 degrees per century, below even the lowest end of their IPCC estimate.
Climate scientists themselves are well aware of how difficult modeling is: while almost all of them agree that climate change is occurring due to human activity, they are far more skeptical of the accuracy of their models and the likely effects climate change will have. For example, only 19 percent felt that their models of sea levels rising due to climate change were any good.
So it seems that climate models using lots of data are not accurate. But could we find a simpler model, one that pays attention only to the signal, and not the noise of countless variables?
It turns out that the level of CO2 in the atmosphere is that signal. Simple models from the 1980s that rely only on current and projected levels of CO2 do a far better job of predicting global temperature development than later, more complicated ones.
What’s more, this relationship is not a mere statistical fluke because it has plausible a cause and effect. The greenhouse effect is a well-established physical phenomenon: greenhouse gases like CO2 accumulate in the atmosphere and trap heat in it.
Unfortunately, accurate predictions are only one part of the solution: nations need to take collective action to change the trend.
The Signal and the Noise Key Idea #11: It’s difficult but not impossible to predict and prevent terrorist attacks.
We’ve all heard of conspiracy theories relating to the 9/11 World Trade Center attacks. Some claim the attacks were so obviously predictable that the US government must have known about them in advance.
For example, in July 2001, there was a warning about heightened Al-Qaeda activity, and in August 2001, an Islamic fundamentalist was arrested due to his suspicious request to be allowed to practice flying on a Boeing 747 simulator. Also, previous terrorist plots of flying commercial jets into buildings had already been discovered.
But actually, the meaning of these signals is only obvious in retrospect. At the time, all this was mere noise: security agencies charged with preventing terrorism have to sift through hundreds of thousands of such potential leads, the vast majority of which lead nowhere.
Nevertheless, the US government should not have been as surprised by this large-scale attack as it was.
Why?
Because data indicates that such attacks are actually to be expected: the frequency and severity of terrorist attacks follows a pattern known as Clauset’s curve. Basically, when attacks are grouped together based on how many fatalities they caused and then their frequency is plotted, we see a very predictable double-logarithmic curve where attacks become less frequent the more devastating they are.
Clauset’s curve clearly indicates that an attack on the 9/11 scale happens roughly once every eighty years, so the government should have been open to this possibility.
The good news is that it seems Clauset’s curve is not set in stone.
Israel seems to have found a successful way of negating the upper end of Clauset’s curve by focusing almost all of its efforts on preventing large-scale attacks, while treating smalls-scale attacks as something almost akin to mere crime. The result has been that, since 1979, no attacks have claimed more than 200 people at once.
Clearly, there is something to this approach that other nations could learn from.
In Review: The Signal and the Noise Book Summary
The key message in this book:
Experts in many areas tend to make astonishingly poor predictions, yet voice far too much confidence in their accuracy. They all trawl through data looking for correlations but, in a world with rapidly increasing amounts of data, this is bound to result in coincidental patterns that will eventually backfire.